


The US Bailed Out Europe. Who Bails Out the US?
Debt isn't pretty but it isn't everything

Summary: Equity markets are slowing down. This type of behavior is expected but it is too early to say if this any reason for concern. The US is still a safe and sound investment in an unpredictable world.
Hope you are all having a good summer. My family and I shifted to Spain for the rest of summer. I am back online now, writing from a Spanish verandah.
Two weeks ago I mentioned the markets were getting too excited. And now things have slowed. We are going to break down what is going on:
🔖Fitch US Downgrade - Too much debt? We saved Europe in WWII, do we need saving?
🔖Market leaders - What they are telling us about the market.
🔖USD - The dollar is not crashing. Why that is not good for stocks.
🔖Dog Days of Summer - What does history tell us about August and September.
🔖The Bottom Line: Nasdaq and S&P. Where are they going?
Fitch Downgrade of the US
Fitch’s downgrade of US debt was a big news last week. First there is the sheer shock of it. In today’s US centric world who would downgrade the US?! Then there is the alarm. The US is the world’s safest, best performing economy. What does this mean for the global economy?
Right now the news is more shock and awe. There is no immediate impact and nothing new has changed with US behavior. The US was and still is the world’s biggest consumer. As a nation we are obsessed with consuming and have been.
I am in Spain writing this and no one here eats food in such large proportions. I have travelled the world and outside of the oil-rich Middle East no one seems to have as many malls per capita as in the US (even after COVID).
Back to US financial health. The short/medium term has not changed. The US has more debt per GDP than anyone else since 2012 (for context, the same measure for a family would be debt to annual income). The country has remained an economic powerhouse through it all because the US is still the center of the global economy and has many other unique assets.

“Oceans rise, empires fall
We have seen each other through it all”
Hamilton The Musical
BUT. In the long term. The amount of debt has started to pull away at a rapid trajectory from the rest of the Advanced Economies. Look at the dark blue line versus the dotted line above. At some point this is unsustainable.
In the long arc of history, empires have crashed due to an inability to pay their debts. The US in part overtook Europe on the financial stage because of the Marshall Plan. The Marshall Plan was the $13 billion ($173 billion in 2023 dollars) US postwar solution to fund the rebuild of Europe. Mighty Europe blew itself up financially and literally.

These are the shifts in world order with crushing debt. There is one country coming to terms with its debt and it isn’t pretty so far - China.
Again focusing on the short term. The USA rebuilt the world to meet our needs and it is still designed that way. We are still sound. And the world thinks so based on the demand for dollars (read later in the article).
Then what is giving the markets pause right now?
Answer: Lagging leaders, USD and Summer. 👇
Market Leaders Look Sick
Moving Average
Before we look at the leaders we need to define one measure that shows up on stock charts. That is moving averages. A moving average (MA) is an average of prices over X days calculated for every day. A 20-day MA is the average over the last 20 days. Popular moving averages in the markets include 20/21 day and 50 day moving averages (there are others).
A slight modification on this is to look at exponential moving averages (EMA). For our purposes, an EMA just makes more recent data more important. If you want to read exactly how it is produced, read here.
How to use these moving averages is much simpler to understand. When prices are above the EMA, this is considered positive. When prices are below an EMA, shorter term traders and investors become cautious.
Market Leaders
What really is driving the market down is the breakdown of leaders. Markets need leaders.
Here is Apple. This had been leading the market all year and after earnings this broke the 50 day EMA. That is an important institutional line in the sand. With the Apple chart broken, the uptrend is broken in the short term for many other companies.

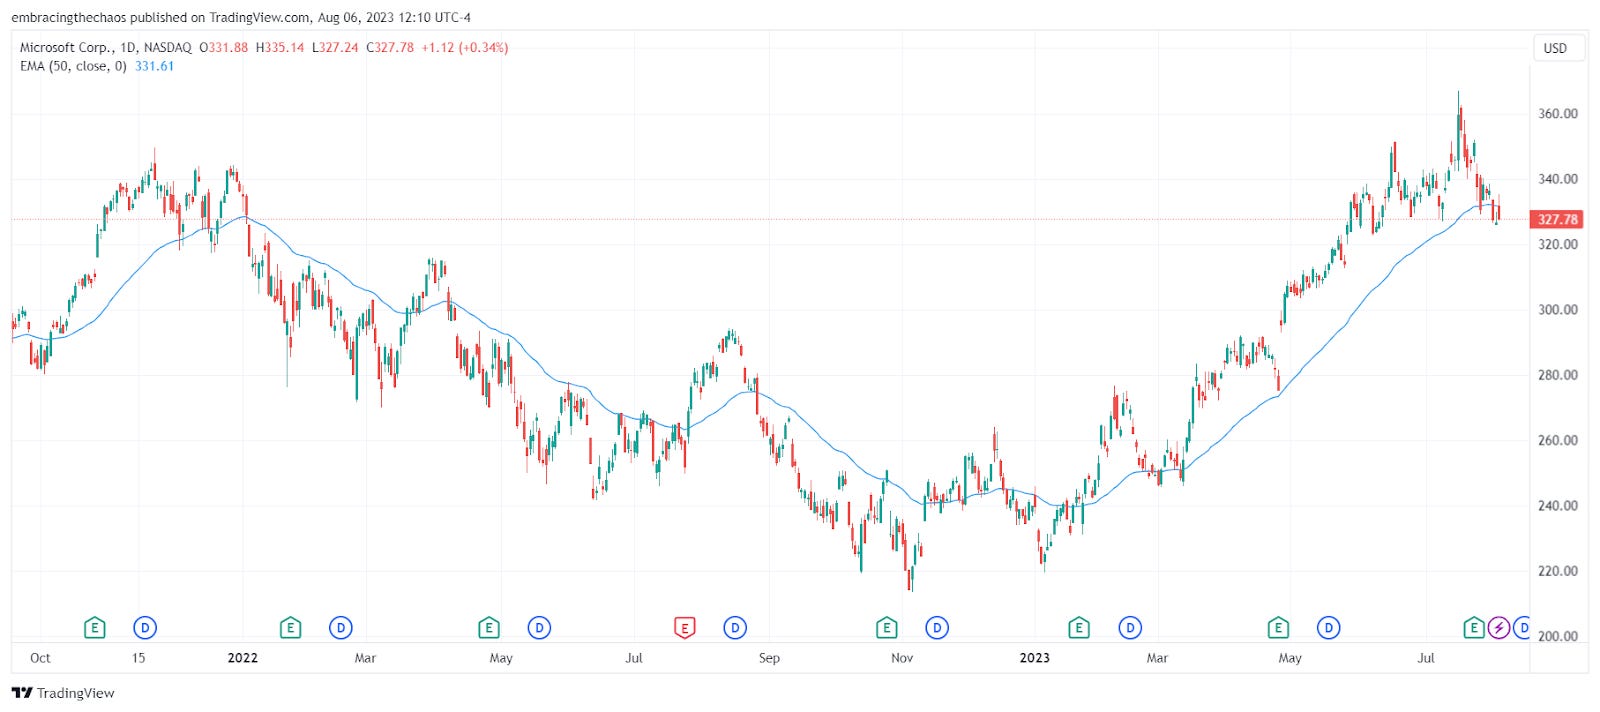
A healthy market doesn’t have a weak Apple. Microsoft, another US leader, also broke below the 50 day EMA.
🛑US Dollar
The Marshall Plan made the dollar mighty and the USD can cause earthquakes in global markets. Right now we are experiencing a small scale tremor.
The US dollar index is not helping the medium term earnings picture. When the USD index was at 100 with the potential to drop further, this was an important tailwind for stocks.
In the last 2 weeks, the opposite of what was expected has happened. The USD has strengthened. When the USD gets stronger this means a few things:
Investors are parking money in the USD for safety. (As I mentioned debt isn’t everything. The US still a symbol of safety, stability, and strength).
The price of goods of US products go up for consumers outside of the US. They may eventually purchase less products from US companies and those profits could go down.
The cost of debt for emerging markets who borrow in USD also goes up.
Item 1 is happening now. Item 2 and 3 become a concern if the US index gets to 105/106 and above.

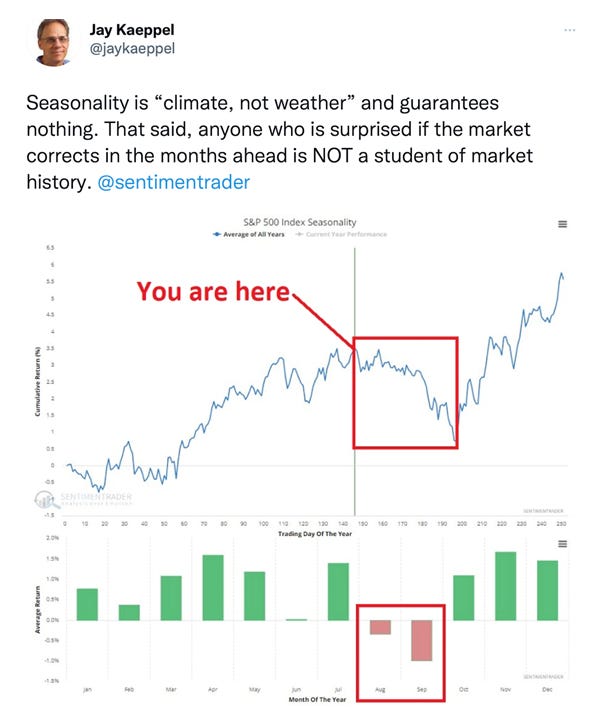
Summer Doldrums
August and September are historically weak periods of the market. More so in pre-election years. And I would think more so after the market has rocketed up all year. As an investor, why risk more money when you have made so much?
The Market Looks Tired
Summary: A 2%-5% decline is normal after this year’s rise.
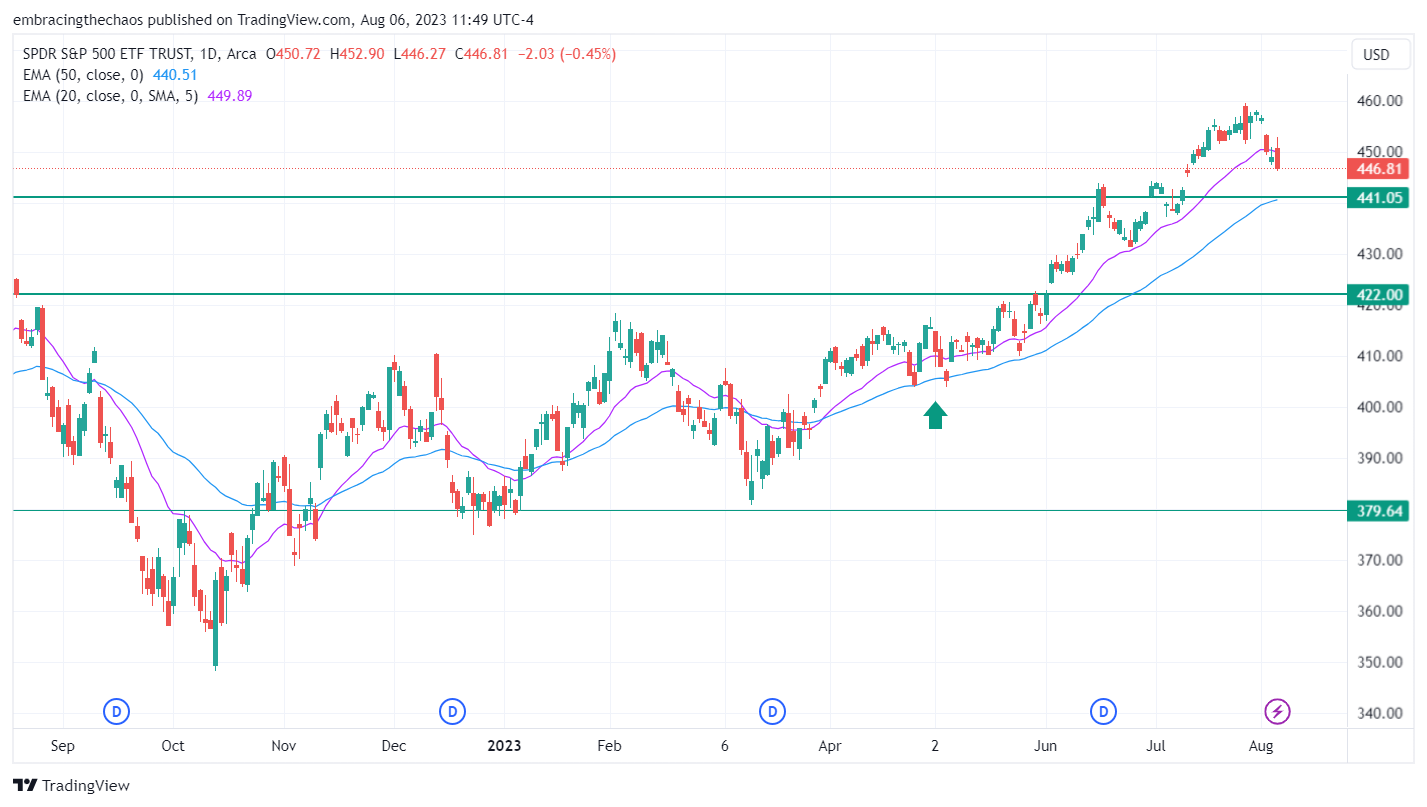
Where does all of this leave us? Let’s go back to the EMA as a guide for the S&P and Nasdaq. If these markets are just taking a break and still healthy, then the EMA is the best guide.
It would be natural for the S&P to decline another 2% to its 50 day EMA in August. This also matches the high prices of July.
In May, the S&P declined to the 50 day EMA before running higher.
We can expect similar behavior for the Nasdaq. At least another 2-3% decline at some point over August. Look at the chart below. The Nasdaq came down to the 50 EMA in March and May before moving higher.

The highest probability outcome is that the markets go sideways or down another 2-5% in the next 3 weeks. In other words, not up but nothing to worry about it in the medium term.
If the markets drop below the EMAs, then we could see 5-10% drop in Sept/Oct.
Whatever the future may bring, the best preparation is a bit of relaxation. Enjoy the rest of summer!
If you have any questions, leave a comment. Thanks for reading Embrace the Chaos! Sharing perspective that makes sense.
Much effort and research went into making this 6-minute read. If you found it insightful, please help me out by clicking the like button and sharing this article.
Sharing is caring!
- Vikas Kalra, CFA